Shine bright like an open source app
Introduction
Shiny app logic I
ui (User Interface)
The container, whatever sees the user
Used for setting the desired configurations of options that will be elaborated in the server
Used for displaying the results of the computations that took place in the server
server
It gets the work done, according to the configuration set in the UI
Replaces the results into the allocated spaces
A flow
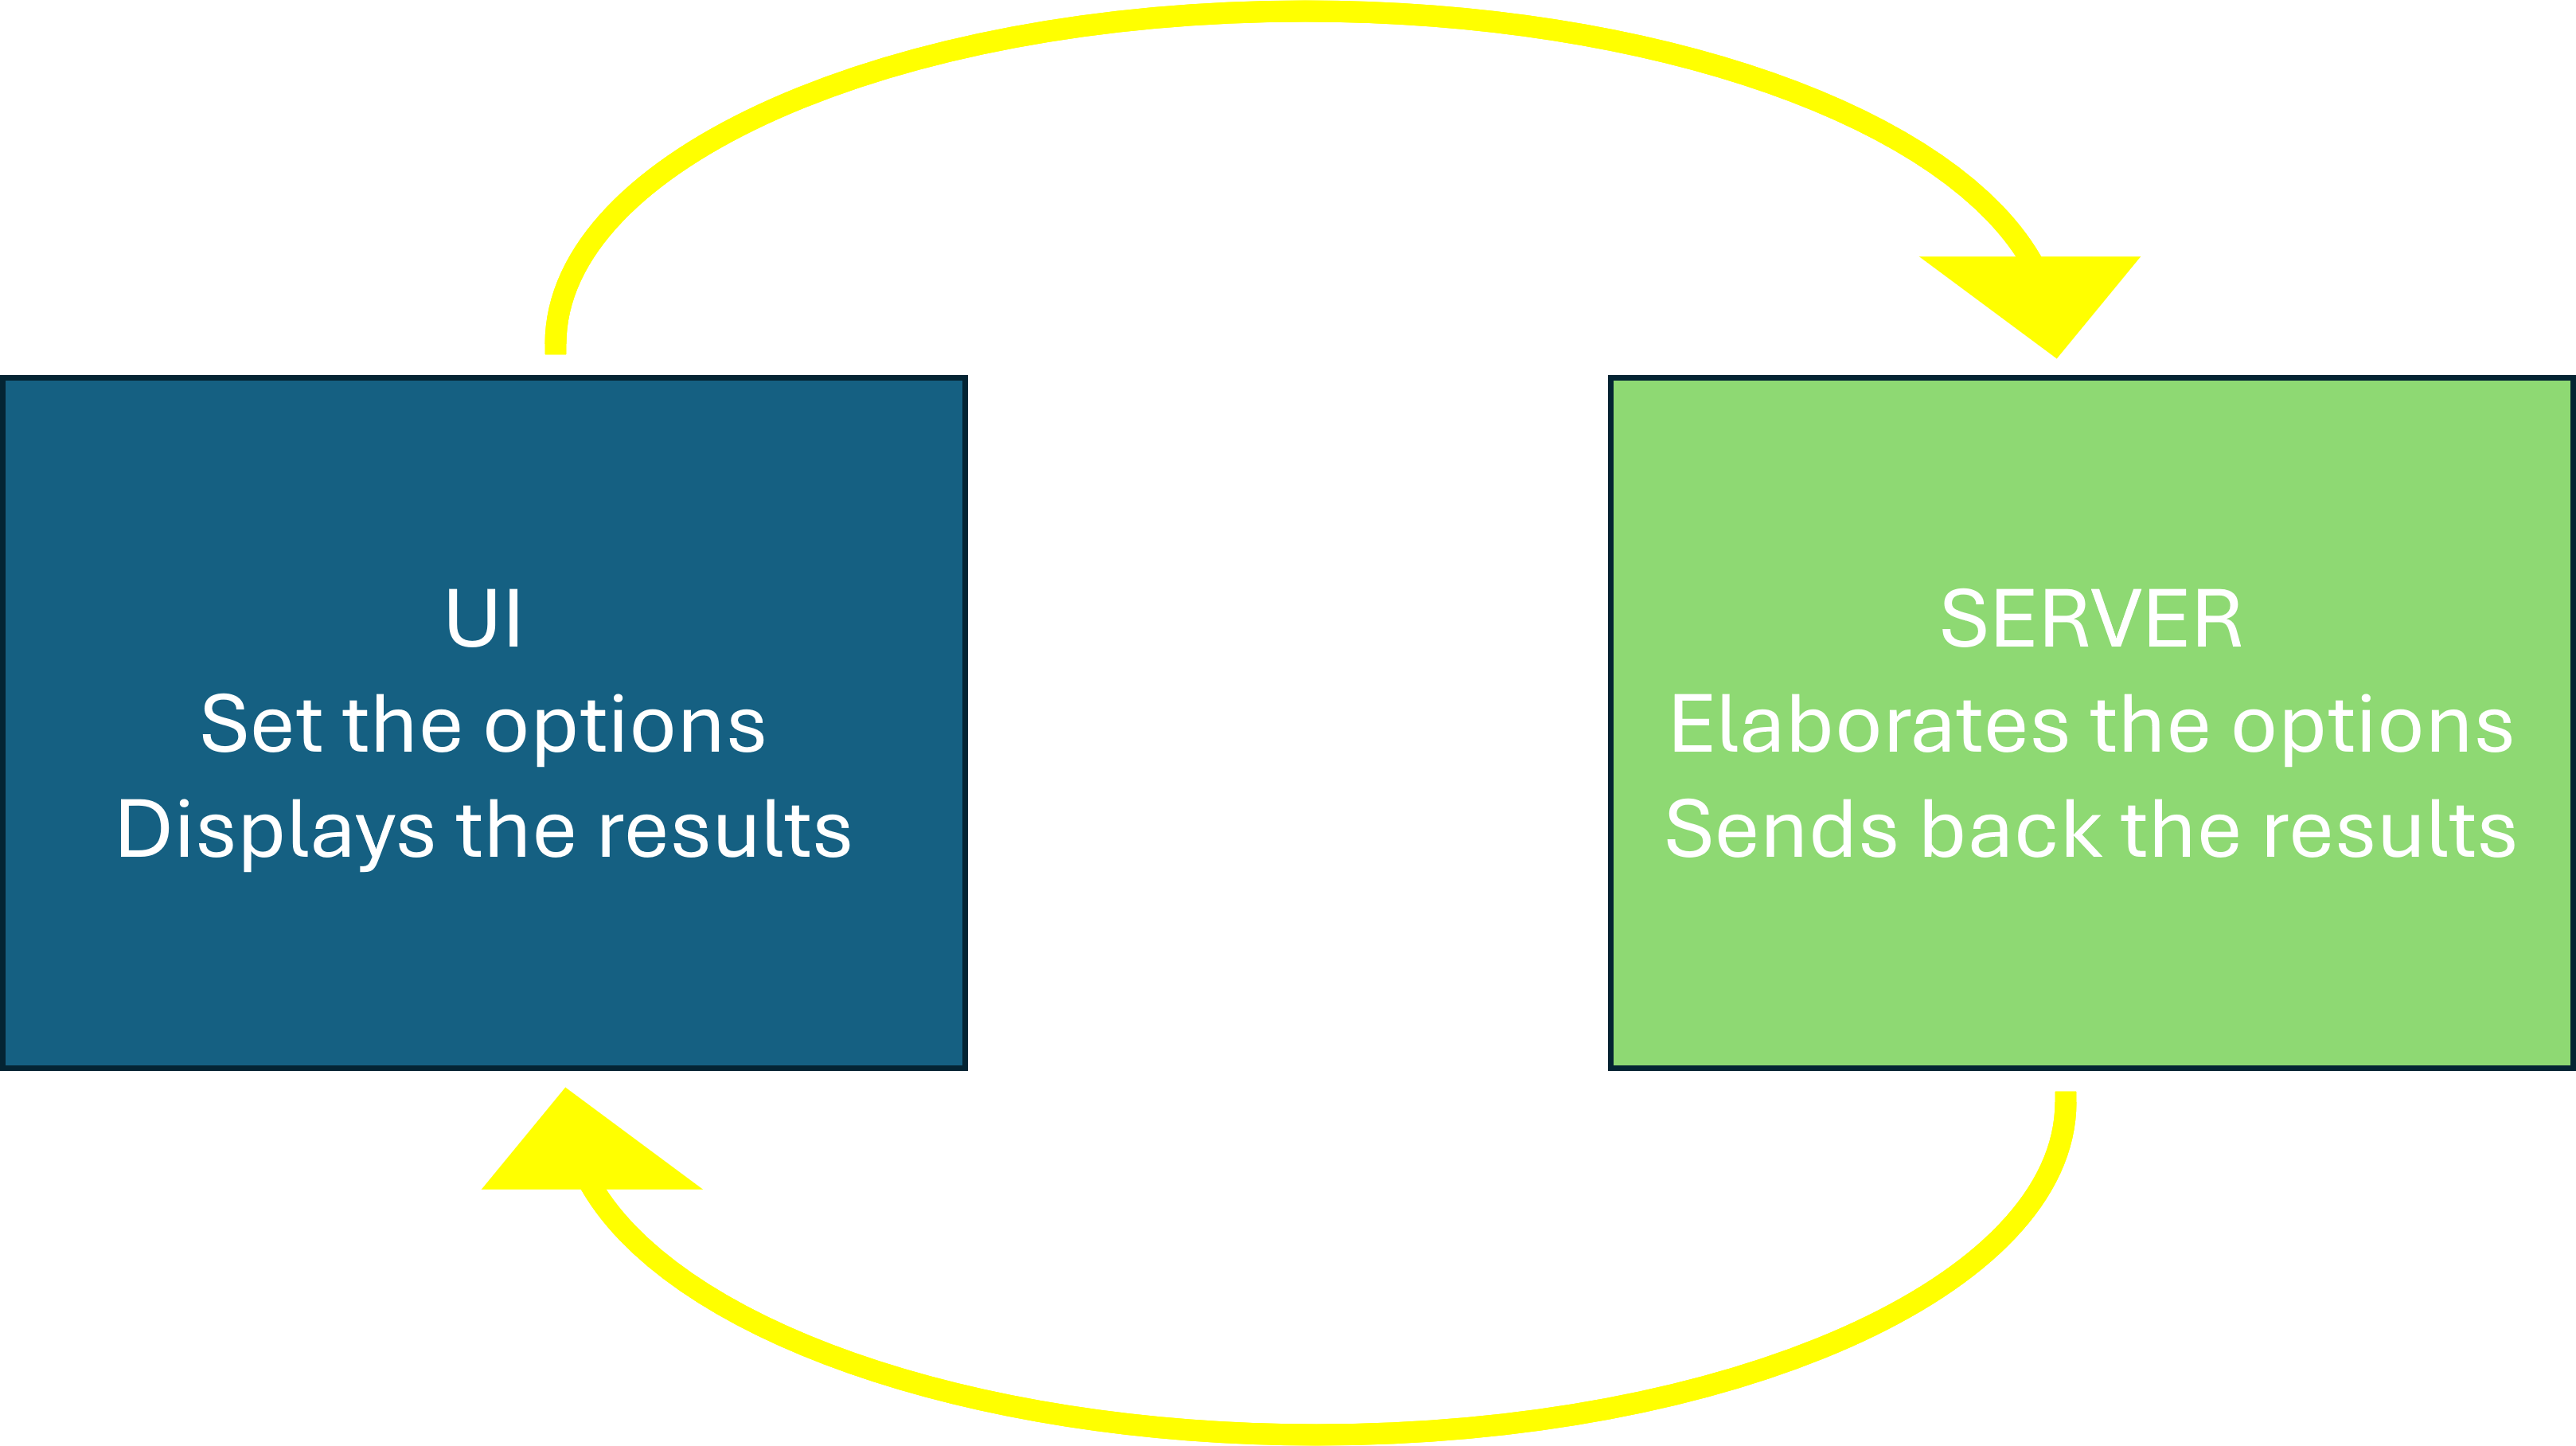
Define something in the
uiand not using in the server: nothing happens, it just doesn’t existCalling something in the server that has not been defined in the
ui: errors everywhere
First things first:
And then:
Yes… it’s that easy
Be tidy, be consistent, save time
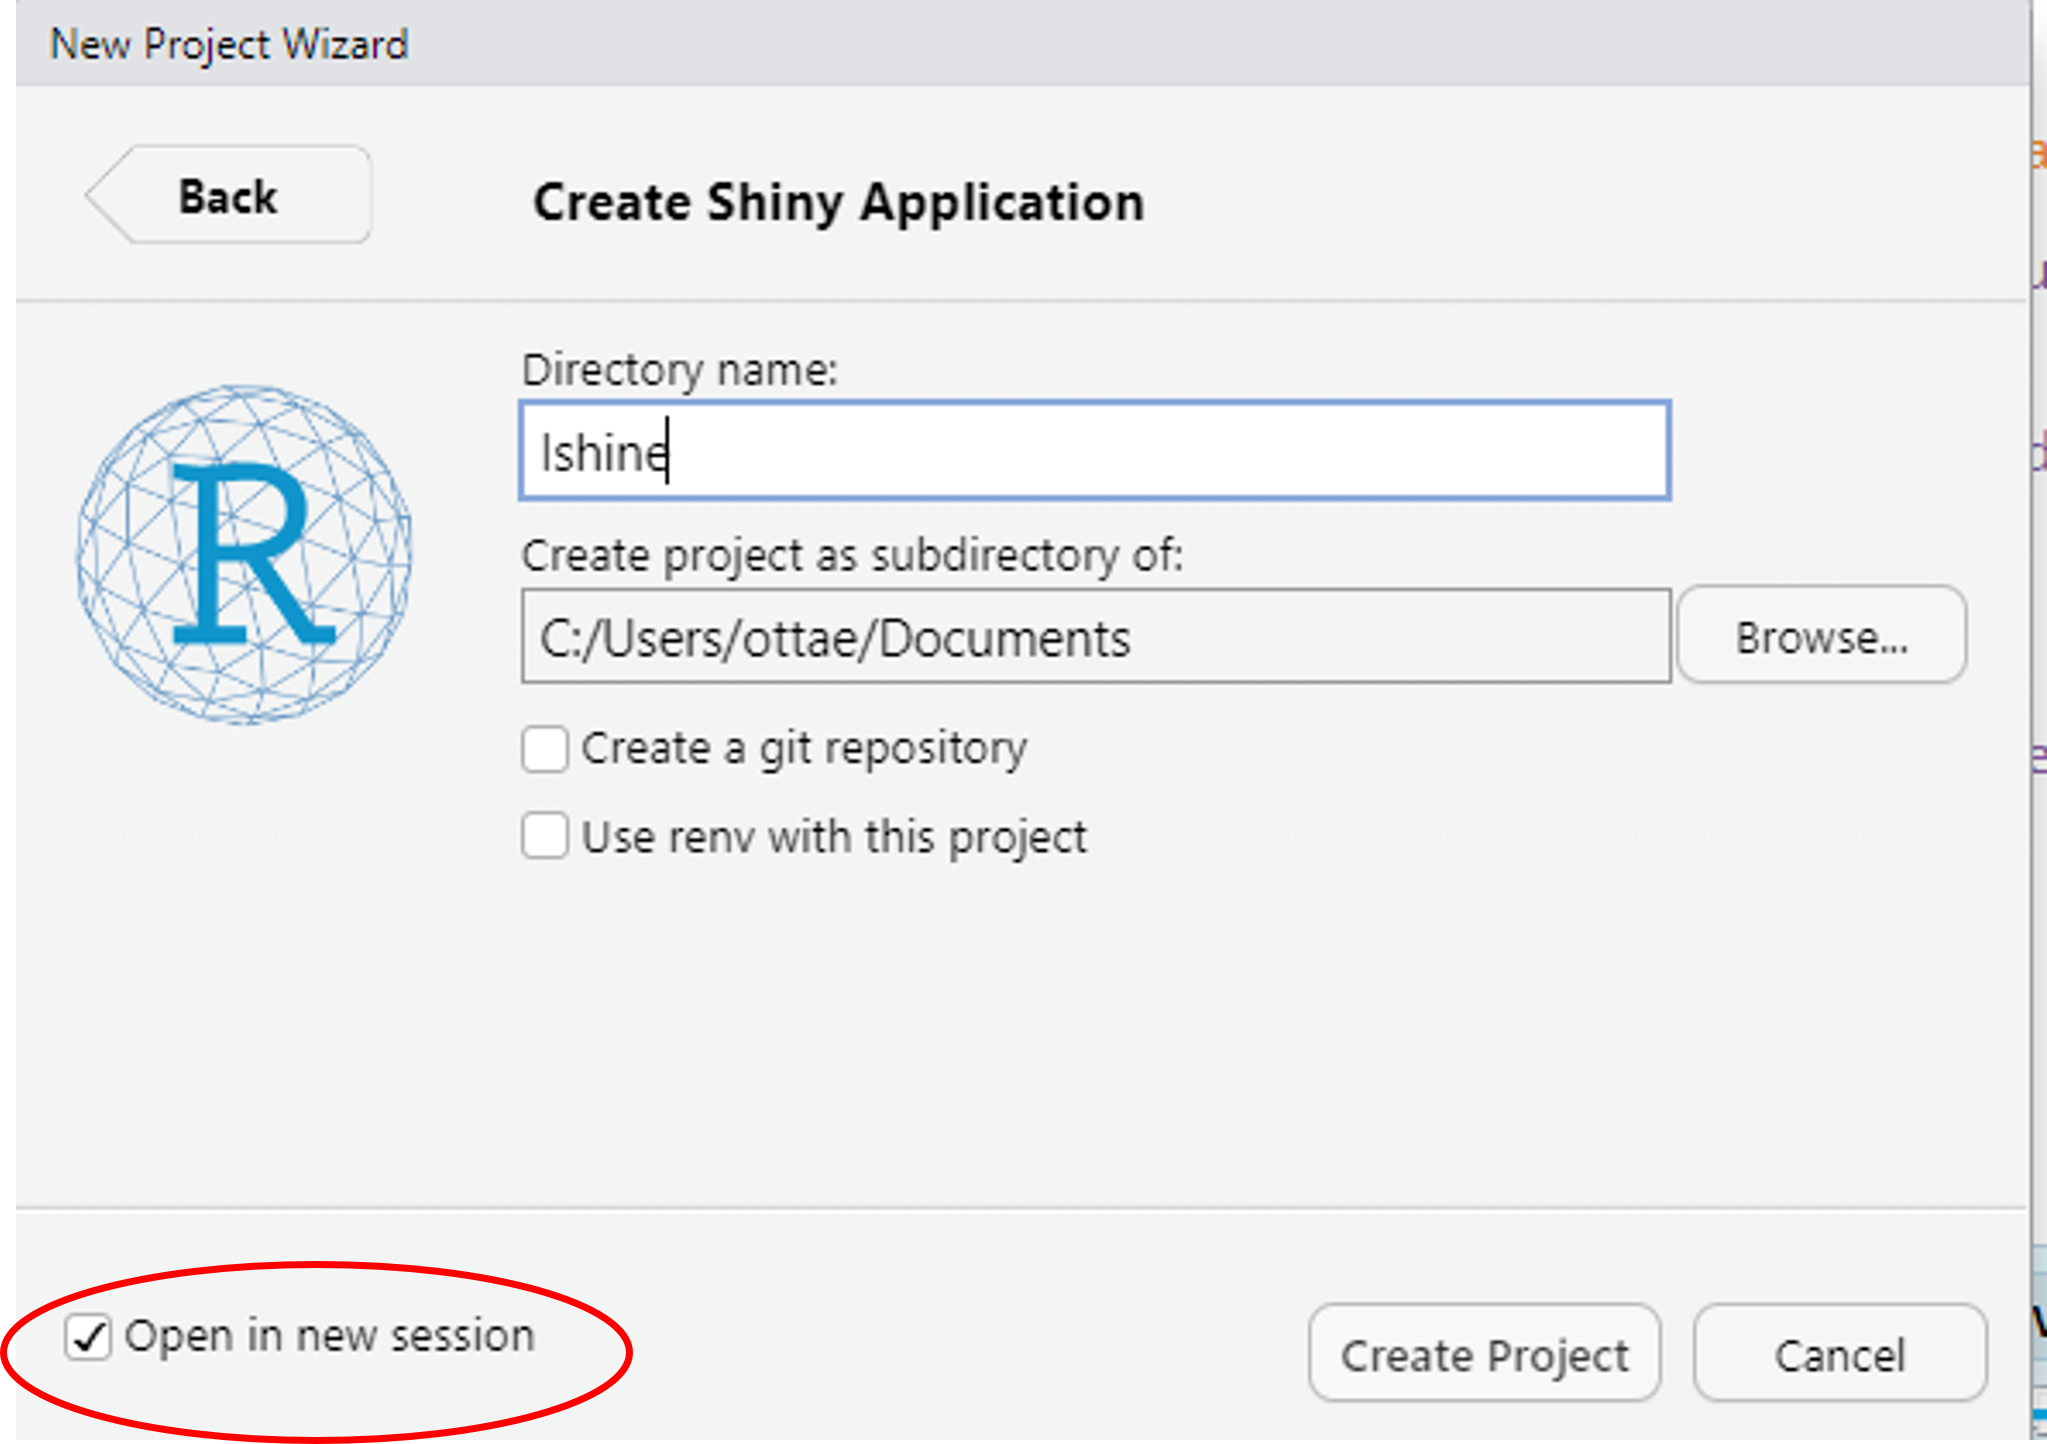
Use
Rprojects with the default for shiny app creations10 minutes coding \(=\) 1 hour of debugging
If the app is particularly complex and long, it’s better to save
uiandserverin two different scripts
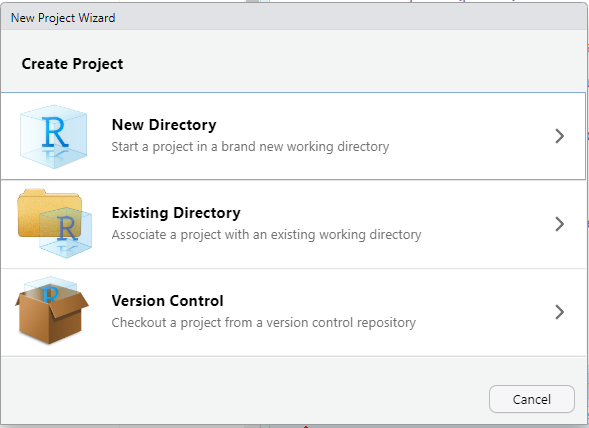
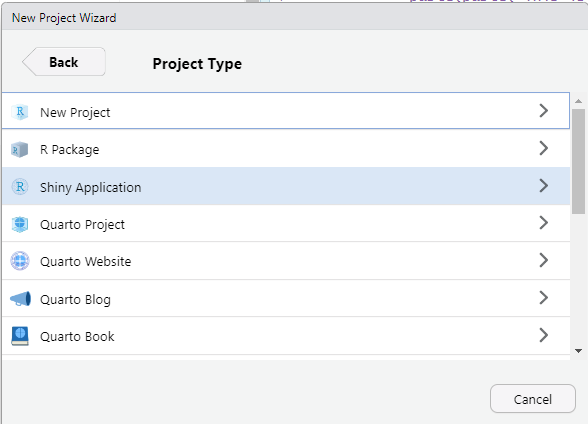
File \(\rightarrow\) New Project:
To each its own: Input in UI
sliderInput()     # Slider input widget
numericInput()    # Numeric input control
selectInput()     # Select list input control
checkboxInput()   # Checkbox input control
checkboxGroupInput()
dateInput()       # Date input
fileInput()       # File upload control
radioButtons()    # Radio buttons
textInput()       # Text input control
passwordInput()   # Password input control
actionButton()    # Action button
dateInput()       # Date input
dateRangeInput()  # Input a data range
Complete list (with code)
To each its own: Output in UI
plotOutput()          # Plot output element
textOutput()          # Text output element
verbatimTextOutput()  # Verbatim text output element
tableOutput()         # Table output element
dataTableOutput()     # Data table output element
htmlOutput()          # HTML output element
uiOutput()            # user interface element
downloadButton()      # Download button
Progress()            # Reporting progress (object oriented)
withProgress()        # Reporting progress (functional)
outputOptions()       # Set options for an output object
Labels:
To each its own: Output containers in server
An astonishing result
appExamples/basic-App.R
ui = fluidPage(selectInput(inputId = "mySelection",
label = h3("Select box"),
choices = list("Choice 1" = 1, "Choice 2" = 2, "Choice 3" = 3),
selected = 1),
verbatimTextOutput(
  outputId = "myOutput"
))
server = function(input, output) {
output$myOutput = renderPrint({
paste(paste("This is my choice"), input$mySelection)
})
}
shinyApp(ui, server)App layout
Complete list (look for “Application layout”)
The app
Code
appExamples/first-app.R
ui <- fluidPage(
  sidebarLayout(
    sidebarPanel(
      selectInput(inputId = "dataset", # name of the input (for the server)
                  label = "Choose a dataset:", # name of the input (for the users)
                  choices = c("rock", "pressure", "cars")) # options (for  both
                                                          # users & server)
    ),
    mainPanel(
      plotOutput( # define the graphical output (we're telling R that this output
        "graph"   # container must contain a plot)
      ),
      verbatimTextOutput( # define the verbatim output (we're telling R that
        "summary"   # this output container must contain a Verbatim output)
      )
    )
  )
)
server <- function(input, output){
output$graph <- renderPlot({
if(input$dataset == "rock"){ # call the input and its options with their label
data <- rock
} else if (input$dataset == "pressure" ){
data <- pressure
} else if (input$dataset == "cars") {
data <- cars
}
plot(data[, c(1:2)])
})
output$summary <- renderPrint({
if(input$dataset == "rock"){
data <- rock
} else if (input$dataset == "pressure" ){
data <- pressure
} else if (input$dataset == "cars") {
data <- cars
}
summary(data[, c(1:2)])
})
}Be like Paganini
server <- function(input, output){
values <- reactiveValues() # create the shelf with reactive values
  dataInput <- reactive({ # create a reactive environment (it reacts to whatever input receives)
    if(input$dataset == "rock"){ # this part is the same as before
      data <- rock
    } else if (input$dataset == "pressure" ){
      data <- pressure
    } else if (input$dataset == "cars") {
      data <- cars
    }
  })
observe({                      # ta-da, the shelf is in action. To make it works,telling R
    values$data <- data.frame(dataInput()) #  it has to be called inside an observe function,
  })                                       # we're using a reactive object
output$graph <- renderPlot({
       plot(values$data[, c(1:2)]) # call the shelf and you're all set
    })
output$summary <- renderPrint({
    summary(values$data)
})
}Slow and steady wins the race
Take things slowly and use the action buttons
There are two ways of using the action buttons:
- Use
eventReactive() - Use the shelf we have seen before and adding the action button
(Throughout the course \(\rightarrow\) solution number 2 because I’m not sure I’m good with solution 1, sorry)