# import packages
import numpy as np
import pandas as pd

# Define path to data, import and visualize data
input_datapath = "C:/Users/enric/Documents/PSICOSTAT/AI meeting 2024_05_22/"
df = pd.read_csv(input_datapath+"Toy_dataset.csv", sep=',')
df| Item | Testo | Scale | Color | DotShape | |
|---|---|---|---|---|---|
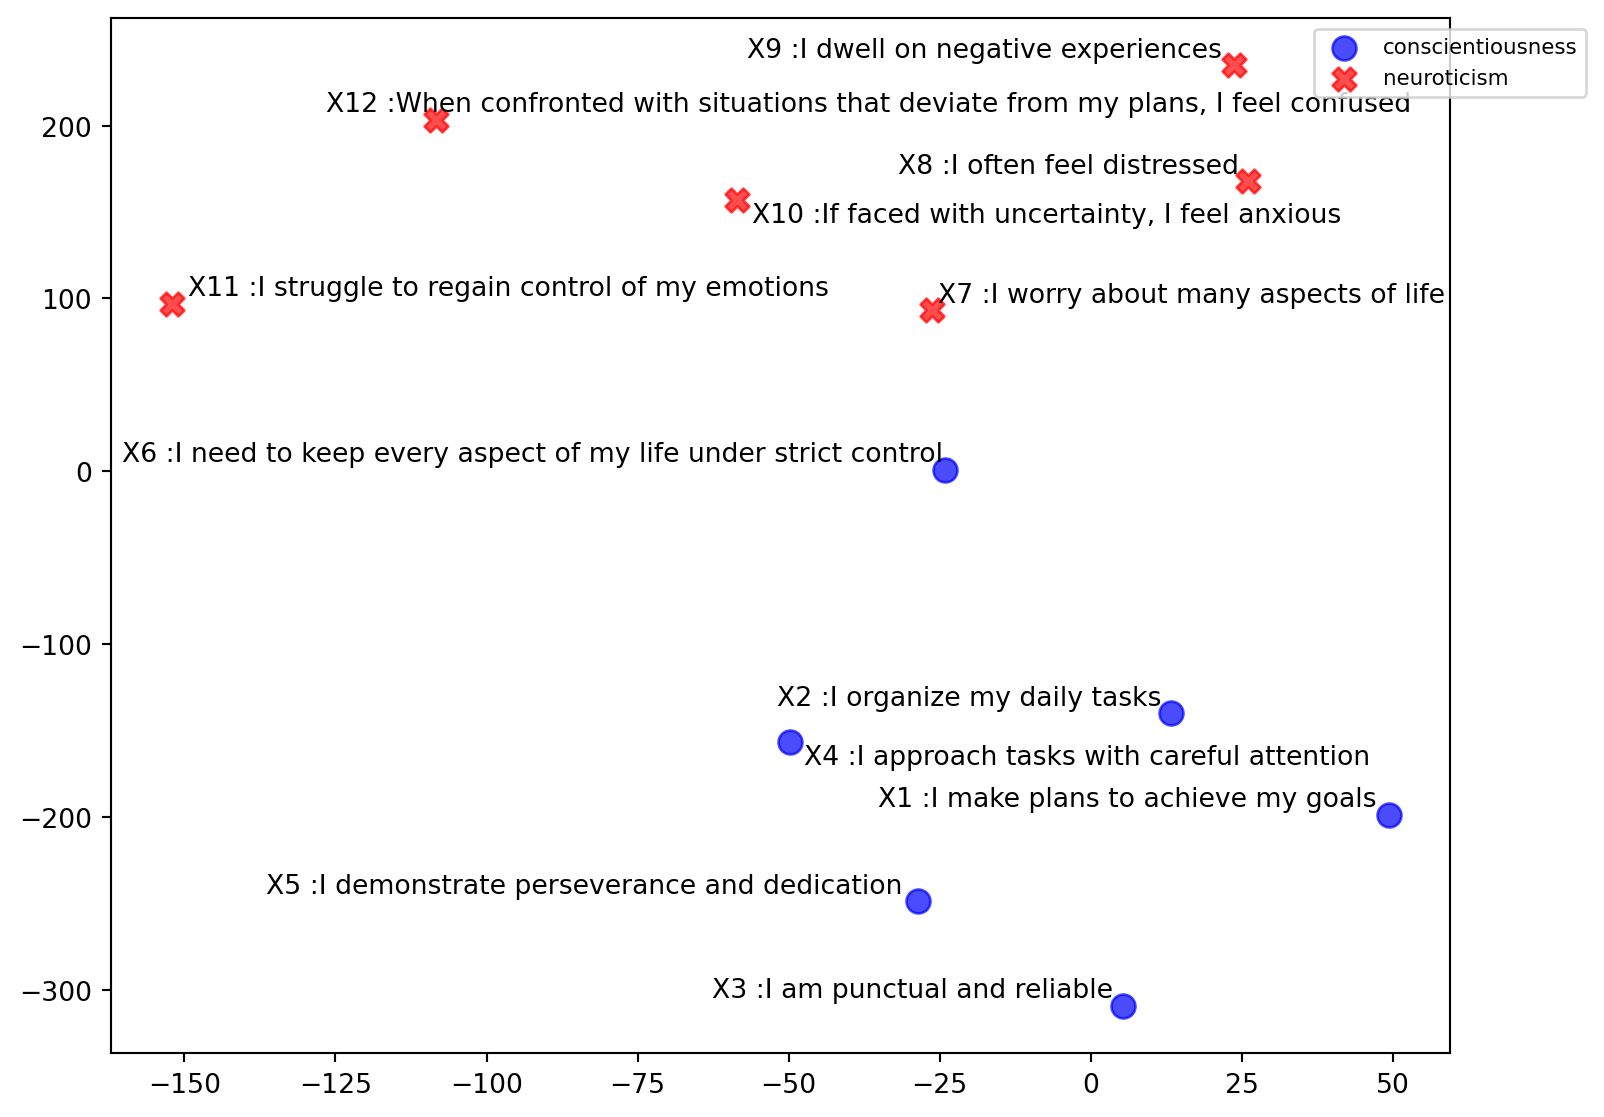
| 0 | X1 | I make plans to achieve my goals | conscientiousness | blue | o |
| 1 | X2 | I organize my daily tasks | conscientiousness | blue | o |
| 2 | X3 | I am punctual and reliable | conscientiousness | blue | o |
| 3 | X4 | I approach tasks with careful attention | conscientiousness | blue | o |
| 4 | X5 | I demonstrate perseverance and dedication | conscientiousness | blue | o |
| 5 | X6 | I need to keep every aspect of my life under s... | conscientiousness | blue | o |
| 6 | X7 | I worry about many aspects of life | neuroticism | red | X |
| 7 | X8 | I often feel distressed | neuroticism | red | X |
| 8 | X9 | I dwell on negative experiences | neuroticism | red | X |
| 9 | X10 | If faced with uncertainty, I feel anxious | neuroticism | red | X |
| 10 | X11 | I struggle to regain control of my emotions | neuroticism | red | X |
| 11 | X12 | When confronted with situations that deviate f... | neuroticism | red | X |